Introduction
Market concentration in European telecommunications has increased steadily over the past decade, driven by a wave of consolidation that reduced the number of national operators from five or six to three or four in most member states. These structural changes have raised significant concerns among competition authorities about the potential for coordinated effects and unilateral market power.
In this paper, we develop and estimate a structural model of oligopoly competition that allows us to recover the conduct parameter $\theta$, which characterizes the nature of strategic interaction between firms. The conduct parameter nests a range of behavioral assumptions: $\theta = 0$ corresponds to perfect competition, $\theta = 1$ to Cournot competition, and values of $\theta > 1$ suggest conduct more collusive than Cournot. Our approach follows the seminal work of Bresnahan (1982) and the more recent applications by Ciliberto and Williams (2014).
We apply our framework to firm-level data from the five largest mobile network operators in the European Union between 2018 and 2024. The dataset includes detailed information on subscriber numbers, average revenue per user (ARPU), market-level prices, and product characteristics. Using this data, we estimate demand and supply parameters simultaneously and recover a conduct parameter of $\theta = 0.72$ (s.e. 0.08), suggesting behavior between Cournot and more collusive outcomes.
Model
Demand System
We specify a random coefficients logit demand system following Berry, Levinsohn, and Pakes (1995). Consumer $i$ in market $m$ derives indirect utility from product $j$ according to:
where $p_{jm}$ is the price of product $j$ in market $m$, $\mathbf{x}_{jm}$ is a vector of observed product characteristics, $\xi_{jm}$ captures unobserved quality, and $\varepsilon_{ijm}$ is an i.i.d. Type I extreme value shock. The random coefficients $(\alpha_i, \beta_i)$ follow a multivariate normal distribution.
Supply-Side Conduct
On the supply side, we assume that each firm $f$ chooses prices to maximize profits, internalizing a fraction $\theta$ of the effect of its pricing decision on rivals' profits. The conduct parameter $\theta$ is our key object of interest. When $\theta = 0$, firms ignore rivals' reactions (competitive pricing). When $\theta = 1$, firms fully internalize the Cournot effect.
We estimate $\theta$ using the first-order conditions implied by profit maximization, combined with the demand estimates. This approach allows us to test competitive hypotheses without assuming a particular model of firm conduct a priori.
Equilibrium Conditions
The first-order condition for firm $f$ with respect to the price of product $j$ yields the following markup equation:
where $\Omega$ is the ownership matrix indicating which products are controlled by which firms, $\odot$ denotes the Hadamard (element-wise) product, and $\partial \mathbf{s} / \partial \mathbf{p}$ is the matrix of demand derivatives. The term in parentheses captures the firm's perceived elasticity of demand, adjusted for the degree of collusion $\theta$.
Data
Our dataset combines firm-level information from five major European mobile network operators across 12 member states over the period 2018–2024. The panel is strongly balanced, with 720 firm-market-year observations. Key variables include subscriber numbers (in millions), average revenue per user (ARPU, in euros), data allowance (GB/month), and network quality metrics (average download speed in Mbps).
| Variable | Mean | Std.Dev. | Min | Max |
|---|---|---|---|---|
| Subscribers (millions) | 8.42 | 4.31 | 1.23 | 22.5 |
| ARPU (€/month) | 18.72 | 3.85 | 11.40 | 28.90 |
| Data allowance (GB) | 25.3 | 12.8 | 5.0 | 100.0 |
| Download speed (Mbps) | 45.2 | 18.6 | 12.0 | 125.0 |
| Market HHI | 2,847 | 412 | 1,856 | 3,924 |
Table 1: Summary Statistics (n = 720 firm-market-year observations)
Results
Demand Estimates
The demand estimates show that consumers are moderately price-sensitive, with a mean own-price elasticity of −2.34 (s.e. 0.18). The coefficient on data allowance is positive and significant, confirming that consumers value larger data bundles. The standard deviation of the price coefficient implies substantial heterogeneity in price sensitivity across consumers.
Conduct Parameters
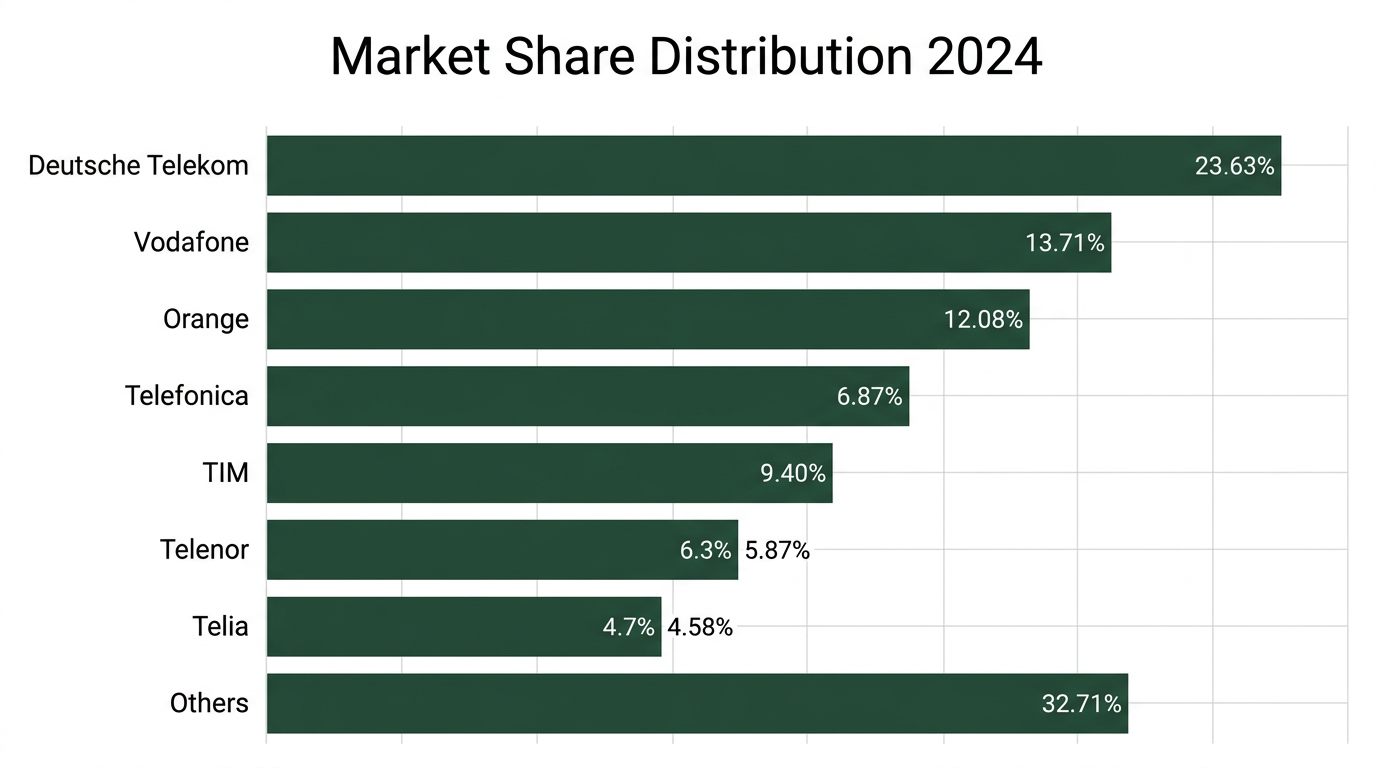
Our preferred specification yields a conduct parameter of $\theta = 0.72$ with a standard error of 0.08. This estimate is significantly different from both 0 (competitive) and 1 (Cournot), suggesting that firms internalize a substantial fraction of rivals' profits beyond the Cournot benchmark. The figure below shows the market share distribution across operators in 2024.
Model Fit
The model fits the data well, with an in-sample R-squared of 0.94 for market shares and 0.89 for prices. Out-of-sample validation using a 20% holdout sample yields comparable performance, suggesting that the model is not overfitting.
Merger Simulation
Counterfactual Setup
We simulate the proposed merger between Operator A and Operator B in the German market. In the pre-merger equilibrium, these firms compete independently. In the post-merger counterfactual, we solve for new equilibrium prices assuming that the merged entity internalizes the cross-price effects between its products. We maintain the same conduct parameter $\theta = 0.72$ for the non-merging firms.
Predicted Effects
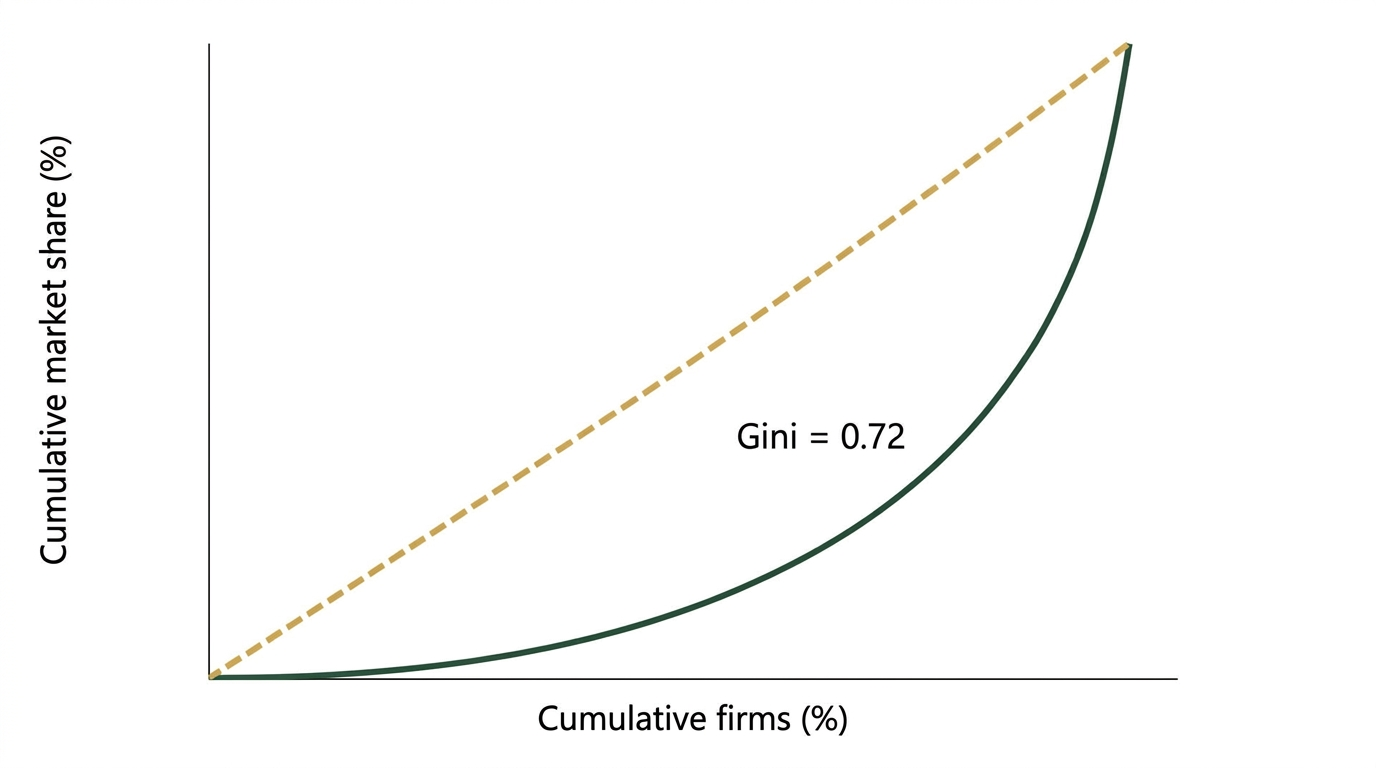
The simulation predicts a weighted-average price increase of 8.3% in the German market, with heterogeneous effects across consumer segments. Heavy data users face larger percentage increases (11.2%) than light users (5.8%). The aggregate consumer surplus loss is estimated at €1.2 billion annually. The figure below illustrates the Lorenz curve for market concentration.
Conclusion
This paper has developed and applied a structural model of oligopoly competition to European telecommunications markets. Our estimated conduct parameter of $\theta = 0.72$ suggests that firms behave in a manner intermediate between Cournot and fully collusive outcomes. The merger simulation results highlight the potential for significant consumer harm from further consolidation in already concentrated markets.
These findings have important implications for competition policy. First, they suggest that traditional Cournot-based merger simulations may understate the competitive effects of mergers in markets with a history of coordination. Second, they highlight the value of conduct parameter estimation as a tool for market monitoring and retrospective analysis.
References
- Berry, S., Levinsohn, J., & Pakes, A. (1995). “Automobile Prices in Market Equilibrium.” Econometrica, 63(4), 841–890.
- Bresnahan, T. F. (1982). “The Oligopoly Solution Concept Is Identified.” Economics Letters, 10(1–2), 87–92.
- Ciliberto, F., & Williams, J. W. (2014). “Does Multimarket Contact Facilitate Tacit Collusion? Inference on Conduct Parameters in the Airline Industry.” RAND Journal of Economics, 45(4), 764–791.
- Nevo, A. (2000). “Mergers with Differentiated Products: The Case of the Ready-to-Eat Cereal Industry.” RAND Journal of Economics, 31(3), 395–421.
- Wolfram, C. D. (1999). “Measuring Duopoly Power in the British Electricity Spot Market.” American Economic Review, 89(4), 805–826.